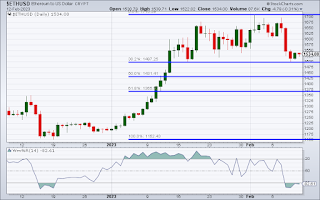
Ethereum the second largest cryptocurrency behind Bitcoin, has shown a nice return in 2023, higher by around +28%. But, as asset prices rise, pullbacks become inevitable, and healthy for further gains ahead. Fibonacci retracement is a common way of understanding the extent to which an asset is retracing the most recent high or recent low. Below is a daily chart of Ethereum, with Fibonacci. Typically I would expect a healthy pullback to the 50% retracement level, which would put ETH at the 1431. Also possible, is the present pullback, at the 38.2% level could hold as support before the next move higher. Daily chart below.
It will be interesting to see where Ethereum trades from here. If the 38.2 % pullback holds or retraces lower to the 50% fibonacci level around 1431. Thank you for reading.
No comments:
Post a Comment